Google Summer of Code 2019
This page is a summary of my adventure through the Google Summer of Code.
Introduction
Graphs allow the visualization of related data, the graph loses its meaning partially when the number of nodes increases. With this plugin, I aimed to present a more meaningful graph to the user by grouping the nodes.
I’ve even added a different graphical representation method (Pie chart, Radial histogram, etc.) in an existing graph, and I’ve created a plugin that can have even more detailed statistical node images.
Plugin Structure
Basically, a structure was created that could work separately from the whole library and allow the user to add their own shapes in addition to the predefined shapes.
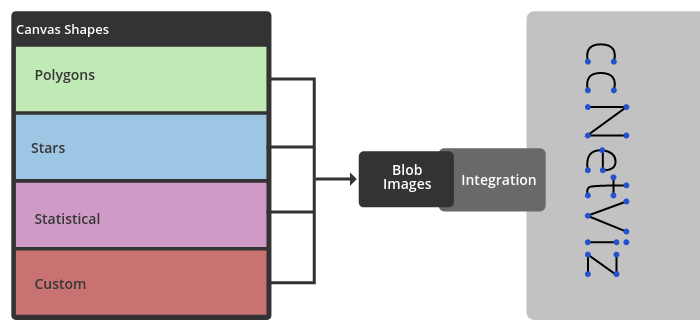
Shapes
- triangle
- quadrilateral
- pentagon
- hexagon
- heptagon
- octagon
- nonagon
- decagon
- star-3
- star-4
- star-5
- star-6
- star-7
- star-8
- star-9
- star-10
- square
- vee
- tag
- GaugeChart
- RadialHistogram
- PieChart
- DoughnutChart
Users can create own shapes via this example.
Animations
Various linear animation structures were created by creating multiple shapes per second.
Color animation

Stroke animation

Testing
I have prepared a continuous integration test for the continuity of the features. I used SlimerJS because it was able to draw graphs headless with Mozilla Firefox.
Other Work
Cytoscape.js Layout PluginBasically, this plugin allows you to use Cytoscape.js layouts to your ccNetViz library.
Thanks
Aleš SaskaHe has a good knowledge of Javascript and he is a great mentor!